MDLP K13 Ultimate

For you ancestral-origin addicts, if your kit isn’t already uploaded to Gedmatch, you might want to consider adding it to their free database.  Not only can you get additional matches from the Big Three DNA companies, but there are numerous admixture tools to explore, including Vadim Verenich’s new MDLP K13 Ultimate.

Vadim discusses and explains his methodology in creating MDLP K13 Ultimate here.  According to Vadim, the tool is especially useful for showing the deep ancestry of Western Europeans.

MDLP K13 Ultimate’s Components

  • Amerindian – the modal component of the Native American
  • ANE – the modal component of the Northern Eurasians, which has been isolated from the common cluster with WHG – the highest values ​​in the samples of MA1, AG2, as well as the ancient genomes from Sintashta, Andronov, Afanasievo, Yamnaya, Corded Ware etc. Among the modern populations the highest percentage of ANE has been detected in Kalash population. Almost the same with the ANE component in Lazaridis et al. 2014
  • Arctic – modal component with peak populations Koryak, Chukchi, Eskimos and Itelmens
  • ASI – еру modal component of South Indian populations (i assume that this component is identical to ASI in (Reich et al. 2009).
  • Caucasus-Gedrosia – identical to Pontikos’s Caucasus-Gedrosia cluster
  • EastAsian – the modal component of East Asia
  • ENF – the component of the ancient European Neolithic farmers with the peak in the ancient samples of LBK culture (Lazaridis et al. 2014, Haak et al. 2015). Among the modern populations – the highest values ​​have been detected in Sardinians, Corsicans and Basques.
  • NearEast – the modal component of Middle Easterners
  • Oceanian – the modal component of the aboriginal inhabitants of Oceania, Austronesian, Melanesia and Micronesia (the peak in modern Papuans and Australian Aborigines)
  • Paleo-African – the modal component of African Pygmies and Bushmen
  • Siberian – the modal component of south eastern Siberia
  • Subsaharian – the second African component (Mandinka, Yoruba and Esan)
  • WHG-UHG – the native component of the ancient European Mesolithic hunter-gatherers (Lazaridis et al. 2014, Haak et al. 2015). Among the modern populations – the highest percentage in the population of Estonians, Lithuanians, Finns and others.

A Test Run

The testers in this experiment include 3 family groups that are predominantly Western European.

Group 1

Group 1 consists of 4 generations of my immediate family as shown in Figure 1.

chart

Group 1 MDLP K13 Ultimate Admixture Results:

group 1

Oracles

Below are each tester’s Oracle 4 results. Oracles are designed to find the population(s) you are most similar to.   As an example of what you might see in your own results, for Gladys I have shown the full Oracle 4 output.  For the rest of the testers, I’ve only included the top estimate in each of the 4 population approximations.  When using the Oracles, ideally you want your results to be a distance close to 1 or less.  The further the distance, the less your sample matches the reference population.  Please note, the MDLP K13 Ultimate Calculator has no Irish samples and thus no Irish population is included in the Oracle estimates.

Gladys mtDNA J1c3e Irish, small amount Alsace

Using 1 population approximation:

1 Germany_South @ 4.725954

2 Welsh @ 4.760169
3 Hungary @ 5.075449
4 Slovenian2 @ 5.144983
5 Slovak @ 5.262948
6 Austria @ 5.263268
7 North_European @ 5.285005
8 Czech2 @ 5.398787
9 Belgian @ 5.461259
10 German @ 5.465462
11 Slovenian @ 5.676105
12 South-German @ 5.796731
13 Austrian @ 5.843022
14 Hungarian @ 5.923850
15 Germany_North @ 6.175276
16 Inkeri @ 6.573199
17 Croat_BH @ 6.697131
18 North_German @ 6.715919
19 English_GBR @ 6.953663
20 Moldavian @ 7.103191

Using 2 populations approximation:

1 50% France +50% Vepsa @ 3.396806

Using 3 populations approximation:

1 50% Icelandic +25% Lak +25% Spanish_Pais_Vasco_IBS @ 2.251328

Using 4 populations approximation:

1 Avar + Basque_French + Orcadian + Swedish @ 1.562552

2 Avar + Basque_Spanish + Norwegian + Swedish @ 1.587619
3 Avar + Basque_French + Norwegian + Swedish @ 1.589907
4 Basque_Spanish + Lak + Norwegian + Swedish @ 1.604312
5 Avar + Basque_French + Icelandic + Swedish @ 1.609077
6 Avar + Basque_Spanish + Orcadian + Swedish @ 1.617271
7 Avar + Basque_Spanish + Scottish_Argyll_Bute_GBR + Swedish @ 1.627082
8 Basque_Spanish + Icelandic + Lak + Swedish @ 1.632314
9 Basque_French + Icelandic + Lak + Swedish @ 1.636813
10 Avar + French_South + Orcadian + Swedish @ 1.652004
11 Basque_Spanish + Norwegian + Swedish + Tabasaran @ 1.676389
12 Basque_French + Lak + Norwegian + Swedish @ 1.702851
13 Avar + Basque_Spanish + Icelandic + Swedish @ 1.707930
14 Basque_Spanish + Orcadian + Swedish + Tabasaran @ 1.720994
15 Avar + Basque_French + Scottish_Argyll_Bute_GBR + Swedish @ 1.737037
16 Avar + Basque_French + Orcadian + Russia @ 1.739913
17 Avar + French_South + Icelandic + Sweden @ 1.740096
18 Avar + Basque_Spanish + Russia + Scottish_Argyll_Bute_GBR @ 1.742547
19 Basque_Spanish + Icelandic + Swedish + Tabasaran @ 1.748318
20 Avar + Basque_Spanish + Orcadian + Russia @ 1.759932

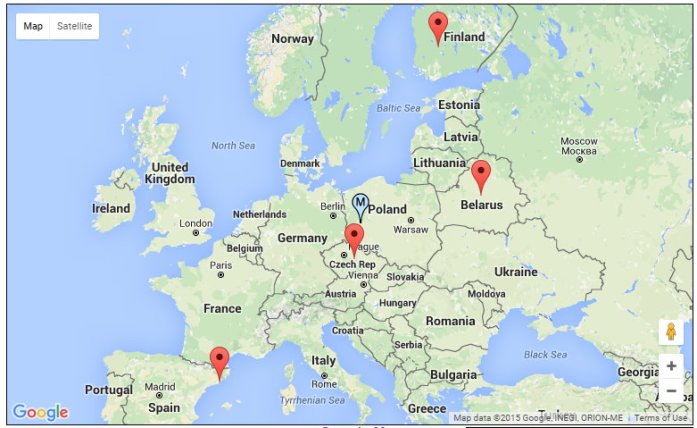
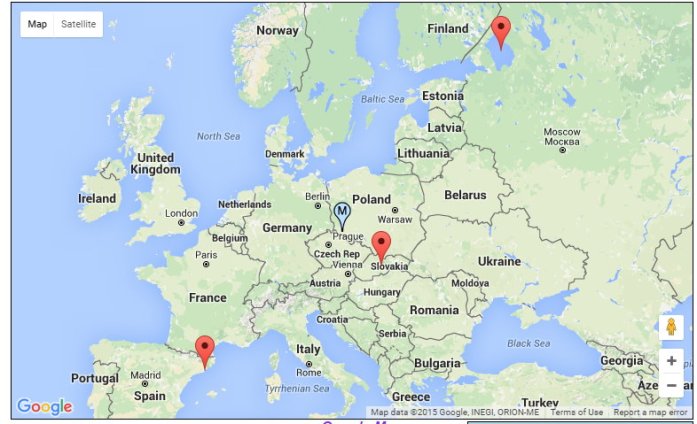
To give a visual representation, I have plotted her 4 population approximation with the Geographic Midpoint Calculator.  The thumbtack with the ‘M’ is the midpoint between the 4 locations. At FTDNA, Gladys is 99% British Isles and 1% Asia Minor.

gladys midpoint

Steve mtDNA J1c3e yDNA R-Z251 ½ Irish, ½ East Flanders

Using 1 population approximation:

1 Germany_South @ 2.569169

Using 2 populations approximation:

1 50% Germany_South +50% Germany_South @ 2.569169

Using 3 populations approximation:

1 50% English_GBR +25% Greek_Comas +25% Vepsa @ 2.216009

Using 4 populations approximation:

1 Basque_Spanish + English_Kent_GBR + Kumyk_Stalskoe + Polish @ 1.199786

Steve’s midpoint plots in the Czech Republic.  Although he is half Irish and half East Flemish, he also has small amounts of Asia Minor and Southern and Eastern European at FTDNA:

steve midpoint

Lori mtDNA W3

Using 1 population approximation:

1 North_European @ 3.871830

Using 2 populations approximation:

1 50% French +50% Vepsa @ 3.446190

Using 3 populations approximation:

1 50% English_Kent_GBR +25% French_South +25% Tajik_Yagnobi @ 2.150152

Using 4  populations approximation:

1 Basque_Spanish + English_Kent_GBR + Orcadian + Tajik_Yagnobi @ 1.698324

lori midpoint

Jeremy mtDNA W3 ¼ English (Newcastle), ¼ Colonial

Using 1 population approximation:

1 Welsh @ 1.196703

Using 2 populations approximation:

1 50% Welsh +50% Welsh @ 1.196703

Using 3 populations approximation:

1 50% English_Cornwall_GBR +25% English_GBR +25% Romanians @ 0.840597

Using 4 populations approximation:

1 English_Cornwall_GBR + English_Cornwall_GBR + English_GBR + Romanians @ 0.840597

J midpoint

Gavan mtDNA W3 half Irish and Scots

Using 1 population approximation:

1 English_GBR @ 3.039722

Using 2 populations approximation:

1 50% France +50% Scottish_Argyll_Bute_GBR @ 2.266037

Using 3 populations approximation:

1 50% English_GBR +25% Spanish_Aragon_IBS +25% Vepsa @ 1.150668

Using 4 populations approximation:

1 Belgian + English_Cornwall_GBR + Spanish_Aragon_IBS + Vepsa @ 1.059918

Ga midpoint

Leona mtDNA W3 ½ Pomeranian, ¼ Norwegian, ¼ Alsatian

Using 1 population approximation:

1 Welsh @ 1.911880

Using 2 populations approximation:

1 50% North European +50% Slovenian2 @ 1.408170

Using 3 populations approximation:

1 50% North_European +25% Slovak +25% Welsh @ 1.243836

Using 4 populations approximation:

1 French_South + Georgian + Latvian + Norwegian @ 1.187358

leona midpoint

Jackie mtDNA W3

Using 1 population approximation:

1 Belgian @ 1.387411

Using 2 populations approximation:

1 50% Belgian +50% Welsh @ 1.096892

Using 3 populations approximation:

1 50% Belgian +25% Welsh +25% Welsh @ 1.096892

Using 4 populations approximation:

1 French_South + Georgian + Icelandic + Sorbs @ 1.075442

jack midpoint

Diane

Using 1 population approximation:

1 South-German @ 1.934086

Using 2 populations approximation:

1 50% South-German +50% South-German @ 1.934086

Using 3 populations approximation:

1 50% North_German +25% Romanian +25% United-Kingdom @ 1.519436

Using 4 populations approximation:

1 English_Cornwall_GBR + Romanians + Slovak + United-Kingdom @ 1.441976

Group 2

MDLP K13 Ultimate Admixture Results

Untitled - 1

As seen in Figure 1, Group 2 includes 2 unrelated mothers, Nancy and Lori, and their sons, AJ and Jeremy who are ½ uncle and nephew.

Oracles

Nancy

Using 1 population approximation:

1 English_GBR @ 1.889876

Using 2 populations approximation:

1 50% English_GBR +50% English_GBR @ 1.889876

Using 3 populations approximation:

1 50% Russian_Orjol +25% Spanish_Pais_Vasco_IBS +25% Welsh @ 1.239205

Using 4 populations approximation:

1 Basque_French + Czech2 + Inkeri + West-Belarusian @ 1.045225

nancy midpoint

AJ

Using 1 population approximation:

1 North_European @ 2.072961

Using 2 populations approximation:

1 50% European_Utah +50% Welsh @ 1.128120

Using 3 populations approximation:

1 50% Czech2 +25% Spanish_Cantabria_IBS +25% Ukranian @ 0.942059

Using 4 populations approximation:

1 Czech2 + Slovak + Sorbs + Spanish_Cataluna_IBS @ 0.914081

aj midpoint

Lori mtDNA W3

Using 1 population approximation:

1 North_European @ 3.871830

Using 2 populations approximation:

1 50% French +50% Vepsa @ 3.446190

Using 3 populations approximation:

1 50% English_Kent_GBR +25% French_South +25% Tajik_Yagnobi @ 2.150152

Using 4  populations approximation:

1 Basque_Spanish + English_Kent_GBR + Orcadian + Tajik_Yagnobi @ 1.698324

Jeremy mtDNA W3 ¼ English (Newcastle), ¼ Colonial

Using 1 population approximation:

1 Welsh @ 1.196703

Using 2 populations approximation:

1 50% Welsh +50% Welsh @ 1.196703

Using 3 populations approximation:

1 50% English_Cornwall_GBR +25% English_GBR +25% Romanians @ 0.840597

Using 4 populations approximation:

1 English_Cornwall_GBR + English_Cornwall_GBR + English_GBR + Romanians @ 0.840597

Group 3

MDLP K13 Ultimate Admixture Results

group 3

Group 3 consists of two full sisters, Jean and Sally, and Sally’s daughter Julie.  Jean and Sally’s father was born in Glasgow from a family that originated primarily in the north of Scotland.  Maternally, they derive mainly from early Irish and German immigrants.  Paternally, Julie’s family has lived in Lippe, Germany for centuries.

Oracles

Jean 1/2 Northern Scots, ½ Colonial

Using 1 population approximation:

1 North_German @ 4.487704

Using 2 populations approximation:

1 50% English_Cornwall_GBR +50% Vepsa @ 3.162740

Using 3 populations approximation:

1 50% English_Cornwall_GBR +25% Scottish_Argyll_Bute_GBR +25% Vepsa @ 2.750026

Using 4 populations approximation:

1 English_Cornwall_GBR + English_Cornwall_GBR + Scottish_Argyll_Bute_GBR + Vepsa @ 2.750026

jean

Sally ½ Northern Scots, half Colonial

Using 1 population approximation:

1 North_European @ 1.952304

Using 2 populations approximation:

1 50% English_GBR +50% North_European @ 1.668977

Using 3 populations approximation:

1 50% Slovak +25% Spanish_Pais_Vasco_IBS +25% Vepsa @ 1.005733

Using 4 populations approximation:

1 Basque_French + Hungary + Russian_Smolensk + Vepsa @ 0.987646

Sally has a small amount of Central Asia in her FTDNA ancestral origins that her sister Jean does not have.

sally midpoint

Julie ¼ Northern Scots, ¼ Colonial, half German (Lippe)

Using 1 population approximation:

1 English_GBR @ 3.404993

Using 2 populations approximation:

1 50% French +50% Vepsa @ 3.007144

Using 3 populations approximation:

1 50% North_German +25% Spanish_Valencia_IBS +25% Vepsa @ 2.082997

Using 4 populations approximation:

1 Basque_French + Slovak + Vepsa + Vepsa @ 1.434730

julie midpoint

Conclusion:

For my testers, the admixture calculators (ANR, ENF, WHG etc) appear reasonable and tick all the boxes I look for when considering the value of admixture tools.  The Oracle estimates are another consideration. As the calculator is exposing deep ancestry, and as a whole very little of the group’s paper trail reaches the 1500’s, let alone precedes it, we have no way of determining its precision.  We can, however, look at the population approximations  passed down and across the group’s generations, as well as consistency between estimated regions and estimated regions/populations from other calculators.

Admittedly, I needed to google some of the reference populations to find where to plot them on the map.  Despite the seemingly exotic populations some of our testers received in their estimates, once each 4 population approximation was plotted (and the non-tested parent’s known ancestry taken into account) for the most part each closely related family member plotted within the same general region.

Of course, as always, we must remember admixture calculators are estimates of ancestry, and a work in progress being improved upon as the science and reference samples grow.  They are interesting, and as long as you don’t let unexpected admixture results derail your genetic and genealogical efforts, they can be entertaining.

Missing and Small Matches

One of the pleasures of having multiple generations tested is the ability to make comparisons.  Like many DNA testers, I’d love to track the source of each match’s connection and map as much of my ancestors’ DNA as possible. When a new match arrives the first task is to determine whether it is a maternal or paternal match, which grandparent it might belong to, and if possible, to assign a more distant ancestral couple.

The more matches you have to work with, the more likely you are to connect with those that will help determine the source of your DNA.  Due to the FTDNA match requirement of at least 20 cM total shared, each kit I manage has many more FTDNA matches at Gedmatch than it does at FTDNA. In some cases, these FTDNA kits match myself and my paternal grandmother Gladys, but not my father Steve.  To determine whether these matches are false or victim of the FTDNA 20 cM total requirement, I took the advice of the larger community.  It was a simple matter to search for FTDNA kits at Gedmatch that matched grandmother Gladys and myself but not my dad.

Regardless of where you have tested, at Gedmatch it is possible to lower the minimum threshold and compare kits on a 1 to 1 basis to tease out or force matches, depending on your perspective.  Is it wise to do so?  According to an ISOGG article on phasing, “It may be reasonable to map some segments in the 3-5 cM range if both the parent and the child share that same segment with the relative but caution is warranted when mapping segments that don’t contain at least 700 or more SNPs because some matching segments could be IBS and not IBD.

Normally, I do not lower the minimum defaults at Gedmatch nor do I recommend doing so.  If you are reducing the threshold at Gedmatch to compare with a suspected relative, to ‘prove’ a match below Gedmatch’s default levels, you are taking a big risk and not necessarily proving what you intended.  However, in this special case of using 4 generations to illustrate missing matches, small matches, and small matches that could appear to some as valid and belonging to a specific ancestral couple, for all comparisons I dropped the minimum levels to 350 SNPS and 3 cM.

Cousin Malcolm

Malcolm fit the pattern of matching my grandmother Gladys, myself and one of my children at FTDNA, but he didn’t match my dad Steve. It was a different story at Gedmatch.

Glad and Malcolm

Figure 1

Steve and Malcolm

Figure 2

As seen by comparing Figures 1-3, Malcolm, Gladys and Steve all match on the highlighted portions of chromosome 1.  I also have an overlapping segment on chromosome 1 as does my son Gavan.  Are the small, non-highlighted segments valid?  Generally, I consider them to be IBS. and whatever their origin, not large enough to pursue.

malcolm

Figure 3

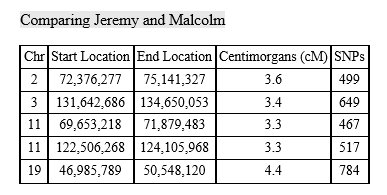
My son Jeremy also matches Malcolm at segments up to 4.4 cM/784 SNPs, none of which were inherited from his grandmother Gladys or our common ancestor shared with Malcolm.   

Jeremy and Malcolm

Cousin Kay

Kay, too, fits the pattern of matching grandmother Gladys, myself and one of my children at FTDNA, and while she matches him at Gedmatch, she doesn’t match Steve at FTDNA.

Gladys and Kay

Figure 1

Steve and Kay

Figure 2

Lori and Kay

Figure 3

When comparing Figure 1 and Figure 2, Steve’s match on chromosome 1 occupies an area within the same start and stop points as the segment he shares with Gladys.  In Figure 3, you can see I also match Kay on chromosome 1, but my start point is 69, 937,274.  The DNA I match with my dad and grandmother has a start point for my dad of 70, 268, 967.  The differences in those start points makes it appear as though I share 8.2 cM of DNA as opposed to the 8.0 cM of DNA my dad shares with Kay.  Although a trivial amount, it could indicate my dad having no calls in that portion, or it could be a case of recombination.

Meanwhile, Kay matches my son Gavan on the same 8 cM segment he shares with me/Steve/Gladys.  On the other hand, my son Jeremy shares 5.6 cM/691 SNPs on chromosome 9 with Kay that he also shares with me but not my father or grandmother.  Jeremy and Kay may have a common ancestor through my grandmother on paper, but it is not reflected in their phased DNA results.

Jeremy and Kay

Cousin Bonnie

Bonnie also matches Gladys at FTDNA but does not match Steve.  Again, Steve has another new match at Gedmatch.

bonnie

On chromosome 1, Bonnie, my dad and I share 6.1 cM/362 SNPs that we don’t share with my paternal grandmother Gladys.  362 SNPs falls well short of the ISOGG recommended minimum of 7 cM/700 SNPs. Chromosome 18 shows a match between Bonnie and myself at 3.2 cM/514 SNPs.  My dad also shares a match with Bonnie on chromosome 18 at 3.4 cM/492 SNPs.  My start point on chromosome 18 precedes the start point for my dad, and is another example of possible no calls or IBS.  Either way, neither small segment was inherited through Gladys and her ancestor in common with Bonnie.

Bonnie and Lori

At reduced threshold levels of 3cM/300 SNPs, Bonnie also matches Gavan on segments that she only otherwise shares with me and not Steve or Gladys.  Bonnie and Jeremy share segments that are shared with no one else.

Gavan and Bonnie Jeremy and Bonnie

Cousin Sean

In this example, at FTDNA Sean matches only my grandmother Gladys.  However, at Gedmatch he is also on my dad’s match list.

Glad and Sean

Figure 1

As seen when comparing Figure 1 and Figure 2, Steve matches an 8.6 cM segment on chromosome 1 with his mother Gladys.  On chromosome 17 we see another small overlap:  3.1 cM/465 SNPs.  The start points vary.

Steve and Sean

Figure 2

Neither I nor my children match Sean at FTDNA or Gedmatch, but our results do represent what type of results we could expect if we were lowering thresholds and comparing 1 to 1 with out the safety net of additional tested generations and their data.  In Figure 3, my results are added and compared against my grandmother and father.  While Sean and I have numerous ‘matches’, up to 5.1 cM,  I didn’t inherit the vast majority of them from my grandmother Gladys or the ancestor we share with Sean, and none of them fall within the phased extreme minimum recommended range of 3-5cM/700 SNPs.

Sean and Lori

Figure 3

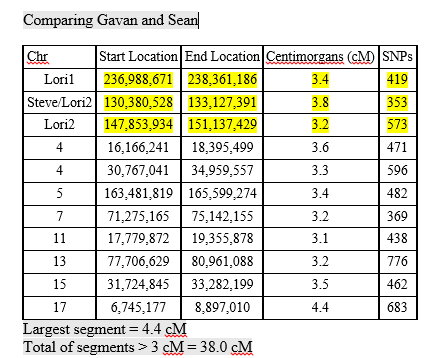
In Figure 4, my Irish born son Gavan is compared to Northern Irish Sean.  He also has matches, with segments up to 4.4cM/683 cM with Sean, although none of them were inherited from Gladys or the ancestor we share with Sean.

Gavan and Sean

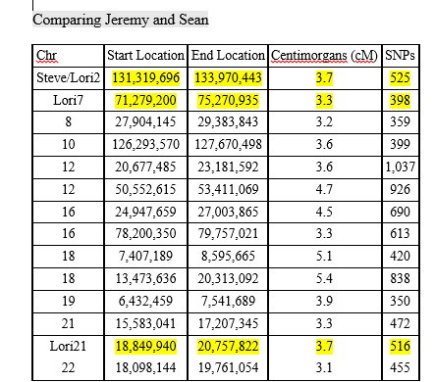
Similarly, my son with deep American Colonial ancestry Jeremy also matches with Northern Irish Sean at up to 5.4 cM/838 SNPs, but again, none of the matches were provided by Gladys and our common ancestor.

Jeremy and Sean

Closer Cousins

chart

Previously, I’ve been concentrating on distant cousin matches that could easily be missed by FTDNA’s minimum requirements but could appear at Gedmatch with single blocks of shared DNA above 7cM/700 SNPs.  In the following examples I am concentrating on another multi-generationally tested family.  Their patriarch, CK is my grandmother Gladys’s 2nd cousin through common ancestors Henry Kane and Katherine Forrestal of County Mayo, Ireland.

Gladys and CK, as second cousins, share abundant DNA in excess of 7 cM/700 SNPs from Henry and Katherine.  They also share 2 segments above 5cM/700 SNPs on chromosome 15.

Gladys and CK

Two of CK’s children, HaK and HeK have also tested. In Figures 1 and 2, we see the DNA they share with both Gladys (G) and CK (C) highlighted, as well as segments that are partial overlaps with Gladys and CK.

Gladys HaK

Figure 1

Glad and HeK

Figure 2

In Figure 3, we see the DNA shared between CK and Steve, Gladys’s son.  All the highlighted portions match CK, Steve and his mother Gladys, including a 3.9 cm/772 SNPs segment on chromosome 15 and  3.9 cM/400 SNPs segment on chromosome 16.  The segments that don’t match Gladys fall below the 700 SNP range.

Steve and CK

Figure 3

Adding a 3rd Generation

HeK and HaK both have children that have tested.  HeK’s son does not appear on any of the match lists of Gladys, Steve, Lori, Jeremy or Gavan.  However, HaK’s children, KaK and KeK do and are shown below, with the highlighted portions illustrating the segments they share with Gladys (G), their grandfather CK (C) and their father HaK (H).

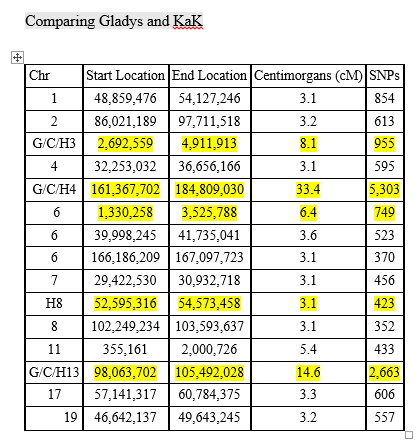
Gladys and KaK

Above, KaK matches Gladys, her grandfather and father  on chromosomes 3, 4 and 13 and partially overlaps on chromosome 6.  The match she shares with her father on chromosome 8 doesn’t match the DNA shared by CK and Gladys. Of the remaining segments KaK  shares with Gladys, on chromosome 1 she shares 3.1 cM/854 SNPs which she does not share with her grandfather CK.

Below are highlighted the shared segments of KeK, his father HaK (H), grandfather CK (C), and Gladys(G). KeK matches his father, grandfather and Gladys on chromosomes 6 and 13 match and partially matches them on chromosomes 3, 15 and 19 . On chromosome 1 KeK share the same 3.1 cM/852 SNPs as his full sibling KaK.

Gladys and KeK

Gladys(G) has a grandchild and Steve (S) a child who has tested (me), so I am also able to compare my segments against the group to ferret out DNA I’ve inherited from Katherine and Henry via my grandmother Gladys.

Lori and CK

In the above example all highlighted matches except one on chromosome 15 match Gladys, Steve and CK.  The smaller segments match neither Gladys nor Steve.

Adding a 4th Generation

My sons make up the 4th generation.  Below, Jeremy has one match at 50.3 cM/13,569 SNPs shared by CK, Gladys, Steve and myself as well as one that is 3.4 cM/492 SNPs. Two of the non-highlighted matches he shares with CK but not his mother or the rest of the group are in excess of 700 SNPs.

Jeremy and CK

Gavan has 4 matches shared between CK, his mother, grandfather Steve and great-grandmother Gladys. None of the non-highlighted matches Gavan shares with CK but not the rest of the group are in excess of 700 SNPs.

Gavan and CK

Putting it Together

Determining whether a match is valid is clearly extremely important when working with your results.  Making sure you have added your kit to Gedmatch, whether you have tested at Ancestry, 23andMe or FTDNA is an essential part of the process.  I haven’t yet gone through all the FTDNA matches missing from my dad’s list that Gladys and I share, but I have yet to find a FTDNA match that has also uploaded to Gedmatch that he doesn’t also match above 7cM/700 SNPs.

Recombination, crossover, IBS, IBD and phasing are important concepts all budding genetic genealogists must grapple with.  Minimum acceptable segment length will doubtlessly continue to be debated and redefined.  Certainly, if you are using reduced thresholds/small segments and haven’t tested a parent(s) you are taking a very big gamble.

For further reading you might be interested in: Small Segments and Triangulation by Jim Bartlett,  Hotspots and Crossover,  and Anatomy of an IBS Segment and What a Difference a Phase Makes by Ann Turner.  You might also wish to add your voice to the subject at the FTDNA forums.

Surnames and Associated Counties

iowa map

With 441 members and 98 of 99 counties represented, the Iowa DNA Project is continuing to grow.  Each new member increases the likelihood of finding matches and learning more about our ancestors and the settlement of Iowa.  Is your surname represented?  If not, consider joining!  If you don’t already have a Family Finder test at FTDNA but have tested with another company, you may wish to consider transferring your raw data.

Surnames and Associated Counties

  •  Adair: Aspinwall, Bates,Hoisington, Lounsbury, Scott, Sias, Nichols, Stillians/Stillions, Newcomb
  • Adams: Shiffer, Riggle, Henry, Jones, Newcomb, Ankeny, Rogers, Fleharty, Knee, Runge
  • Allamakee: Whalen, Regan, Devine, Laughlin, Danaher, Ryan, Fitzgerald, Born, Dee, O’Conner/Conner,Kruger, Winke, Flage, Henning, Ludeking, Baxter, Butler, Buckley, Ralston,Archibald, Sires, Duff, Speigler, Healy, Brady, Werhan
  • Appanoose: Milburn, Awalt, Morlan, Murphy, Brown, Robinson, Phares, Flowers, Crawford, Martin, Jackson, Gates, Wilcox,Watson, Zimmerman, Richards, Bowman, Richards, Van der Heyden
  • Audubon: Drake, Finch, Burns, Chase, Follmer, Liles, McGuire
  • Benton: Gallup, Dilley, Stewart, Cue, Calhoon, Younglove, Hinkle
  • Black Hawk: Belt, Whaylen, Corrigan, O’Neill, Stewart, McNaughton, House, Purdie,Mallett, Richmond, Bates, Robinson, Kerns,Beirschmitt, Duffy, Kane, Forrestal, Burns, Flaherty, Kennedy, Harned, Singer, Robertshaw, Olsen, Jensen,Hansen, Morgensen, Baer, Bender, Buehner, Call,Carpenter, Fuller, Hare, Haun, Meisch,Neisen, DuBois, Kelly
  • Boone: Lyman, Benjamin, Fenn,Harmon, Smith, Miller, Peachey, McGregor,Ballentine
  • Bremer: Harned, Singer, Baer, Bender, Buehner, Call, Carpenter, Fuller, Hare,Haun
  • Buchanan: Leach, Chicken, Grim,Duffy, Kane, Forrestal, McCloskey, Kinney, Clark, Harned, Singer
  • Buena Vista: Jessip, Carney, Marshall, Howard, Dale, Ginn, Taylor,Larson, Johnson,  Lydell
  • Butler:  Bigsby
  • Calhoun: Osborn, Godwin
  • Carroll: Wilkens, Piper, Conner, Wenck, Best, Rabe, Brunen, Wilberding, Grever/Grefer, Willenborg
  • Cass: Scovel, Baker, Gillpatrick, Randles,
  • Cedar: Orcutt, Dutton, Baker,Gaines, Gillpatrick, Randles, Wagner, Knipfer, Mottschall, Follmer, Liles
  • Cerro Gordo:  Hacker
  • Cherokee: Beyer, Schubert, Sorensen,Smith, Larson, Johnson, Lydell, Gengler, Niehus, Foerster, Heinis, Niggeling, Nothem, Engeldinger, Wanderscheid, McCulla
  • Chickasaw: Robinson, Colligan, Pierson/Pearson, Hawkins, Glass, Pangborn
  • Clarke: Sowers, Lee
  • Clay: Ewing, Knee
  • Clayton: Scovel, Cagley, Hulverson/Halverson, Sass, Roth, Kamin, Wilke, Meye, Clark, Weideman/Wedeman, Stevens, Greene, Beckmann, Stutheit, Hempeler, Ewing, Richards
  • Clinton: Berg, Wink/Wienke,Johnson, Halversen, Halverson, Halvorsdatter, Maklebust, Hansen, Johannesdatter,Dossland, Ask, Olson, Carter, Edwards, Hazlett, Whitaker, Coffman, Cunningham, Van Cruijningen, Alcorn, Chase, Hartson, Clark
  • Crawford: Endrulat, Reese, Jahn, Krause, Kutschinski, Wiese, Klaus, Eyer,Neddermeyer
  • Dallas: Hanlon, Brady, Shiffer, Cone, Ballentine, Andersdotter, Jonsson,Curfman, Nichols
  • Davis: Lohrengel, McGachey
  • Decatur: Davis, Newcomer, Lushbaugh, Webster, Roselle, Dale,Marksbury, Higgs, Weable, Anderson,Sly
  • Delaware: Klaus, Clark, Webb, Arnold, Duncan, Field, Alloway, Fuller, Anderson, Rexford, Paddleford, Walker, Cline, Willenborg, Braun
  • Des Moines: Peterson, Childs
  • Dickinson: Guthrie, Lambertus, Franker, McCulla, Nicolas
  • Dubuque: Wentz, Consor, Krueger, Metcalf, Noesen, Nattrass, Robson, Daykin, Hoffmann,Heiter, Pauly, Gloesener, Kayser, Miller/Mueller, Jordan, Singer, Boock, Wilberding, Johanning, Feldmann, Schaupmann, Jasper, Siemes, Tauke, Braun, Kleespies, Albert, Blitsch, Conzett, Jecklin, Mathis, Moser, Osterberger, Schauer, Strauch
  • Emmet: Hansen, McCulla, Allen, Crim, Doyle, Wilson
  • Fayette: Glass, Pangborn, Kappes, Bodensteiner,Vanginderhuyser, Wise, De Temmerman, Georgi, Kern, Amundsen, Kerns,Beirschmitt, McCloskey, Gifford, Johnston, Tope, Mittelstedt, Wroe, Burns/Burnes, Clark, McCann, Houlsworth, Perry, Wait/Waite, Finch, Kuhens/Kuhnes, Ewing, Johnston
  • Floyd: Miller, Klaus, Reed, Stickney
  • Fremont:  Garcia, Enos, Davina
  • Guthrie:  Dilley
  • Grundy: Campbell, Whitehead, Miller
  • Hamilton: Teget, Toedt, Pahl, Wing,Johnson, Dale
  • Hancock:  Nix
  • Hardin: Wing, Johnson, Vinje, Kelsey
  • Harrison:  Kirley, McBride, Davis, Jordan, Lewis, Anderson, Bolte
  • Henry: House, Sample, Shelton, Allen, Billingsley, Malone, Houston
  • Howard: Osborn, Gifford, Cushing,Roberts, McCulla, Johnston
  • Humboldt: Hilbert, Ewing
  • Ida: Beyer, Endrulat, Grell, Haase, Helkenn, Reese, Schubert, Bauer, Meyer,Paustian, Ruhser/Ruser, Schroeder, Sorensen, Wink/Wienke
  • Iowa: Duffy, Burns, Masteller,Gallagher, Burns, Kinney, Murphy, Duggan, Welch
  • Jackson: Berg, Meyer, Wink/Wienke,Johnson, Halversen, Halverson, Halvorsdatter, Maklebust, Hoffmann, Miller/Mueller, Johannesdatter, Naegle, Nagel, Mueller, Carter, Edwards, Zeimet,Winkel, Conzett
  • Jasper: Belt, Hyde, Pahl, Toedt, Holliday, Hickey, Debolt/De Bolt, Ross, Nichols, Weigel, McKlveen
  • Jefferson:  Wygle
  • Johnson: Minnich/Minnick, Lyle,Crossen, Fitzgerald, McCarthy, James,Bigsby, Coffman, Kile
  • Jones: Hanlon, Brady
  • Keokuk: Wilson, Willson, King, Belveal
  • Kossuth: Young, Hilbert, Becker, Richter, Sires
  • Lee: Childs
  • Linn: Stewart, Cue, Calhoon, Gaines, Rickert, Richard, Wagner, Poorman,Gates, Wilcox, Watson, Zimmerman, Richards, Bowman, Stevens, Webb, Osterberger
  • Louisa: Johnston, Herron, Ramsey, Smith, Hand, Vanloon
  • Lucas: Stevenson, Coffelt, Vickroy,Welch, Truman, Hickman, Hasting, Davis, Mumford, Cain, McGlothlen, Rodgers,
  • Lyon: Follmer, Liles
  • Madison: Shutt, Black, Cashman, Benedict, Marchel, Wolfe, Peed, Ross, Debolt/DeBolt, Gates, Wilcox, Watson, Zimmerman, Richards, Bowman
  • Mahaska: Heberer, Howard, Burke, Conklin, Holliday, Adair, Ives, Lowry,Ferrell, Addis, Adkisson, Zeppernick, Williams, Parr, Hoskinson, Myers, Wymore,James, McMains, Hollingsworth
  • Marion: McCombs, Howard, Godwin, Barr, Wilson, Cashman, Williams, Newman, Childs
  • Marshall: Wantz, Bryant, Brown
  • Mills: Gowdy, Chamberlain, Hambsch, Oestreicher
  • Mitchell: Baker, Gaines, Mackin,Kinney, Gerbig, Decker, Galt, Tretton, Gemaehlich, McCulla
  • Monona: Nepper,Ordway, Ziems, Freerking
  • Montgomery: Lee, Pittman
  • Muscatine: Orcutt, Allen, Kuiper, Heuer, Pasdach, Yeater, Huff, O’Brien,Cain/Kain/Kane, Cashman, Alcorn, Ipock, Yates, Freers,Schreurs, Washburn, Bigsby, Ager, Everett, Follmer, Liles, Fulmer/Fullmer, Kingsbury, Stiles
  • O’Brien: Stewart, Runge
  • Osceola: Hamann, Schubert
  • Page: Nicolson, Teget, Cox, Krey
  • Palo Alto: Williamson
  • Plymouth: Storer, Gengler, Niehus, Foerster, Heinis, Niggeling, Nothem, Engeldinger, Wanderscheid, Wilberding
  • Polk:  Smith, Hanlon, Brady, O’Connell, Wilson,Beatty, Stevenson, Coffelt, Burnett, Scovel, Foutch,Halterman, Boatwright, Davis, Freel, Stewart,Johnson, Warren, Flesher, Deaton, Powell, Freel, Butler, Shiffer, Brooks,Holliday, Lawrence, Cooper, Shutt, Cone, Mason, Baber, Nalley, Higgs, Kirsher,Huggins, Jones, Debolt/De Bolt, Nichols, Klaus, Poorman, Gates, Wilcox, Watson,Zimmerman, Richards, Bowman, Hendricks, Compton, Giese, Childs, Ewing, Mills, Bowers, Town
  • Pottawattamie:Shanahan, Gallup, Stuart, Dolan, Hale, Davis, Wires, Fitzgerald, McCarthy, Randles, James, Slingerland, Kirley, McBride, Johannsen
  • Poweshiek:Watson, Sebring, Krouskop, Carpenter, Krise
  • Ringgold: Hazen, McCurdy, Carpenter,Humphreys, Cone, Arnold, Thorla, Newman
  • Sac: Schroeder, Masteller,Staton, Ragsdale, Masteller
  • Scott: Conrad, DahlDall/Doll,Frauen, Grell, Haase, Hamann, Helkenn, Reese, Rusch, Steffen, Bauer, Schween,Heckt, Paustian, Ruhser/Ruser, Sorensen, Kivlin, Feeney, Baugh, Collins,Jacobs, Crouch, Wulfe, Brus, Aufdenspring,Murphy, Foley, Ginn, Mills, Jones, Reed, Elshorst, Boock, Eggers, Fendt, Meier, Runge, Tiedje, Parker, Snider, Miller, Herr, Villain,  Moravek, Byers, Finkenhoefer, Traeger, Busch
  • Shelby: Gallup
  • Sioux: Meyn
  • Story: McDowell, Allen, Wing,Page, Hansens, Guddal
  • Taylor: White, Pace, Stephens
  • Tama: Howard, Krise, Boock
  • Union: Krise
  • Van Buren: Downard, Payne, Freel, Miller, Marriott, Shipley, Watt/Watts, Childs, Billingsley
  • Wapello: Ward,Hartshorn, Lowery, Robertson
  • Warren: Stewart,Black, Halterman, Flesher, Turnipseed, Deaton, Freel, Shutt, Cashman, Braucht,Mason, Vickroy, Wiley, Douglas, Williams, Martindale, Pierce, Hasting, Michael,Daugherty, Grant, Davis, Stewart, Cue, Calhoon, Flowers, Crawford, Fulmer/Fullmer
  • Washington: Longwell, Jury, Phillips,Deen, Downing, Bradford, Lambert, Story, Carr
  • Wayne:  Hanlon, Jones
  • Webster: Carpenter, Porter, Feeney, Carter, McQuiston, Mabe, Berry, Cackler, Doherty, Coles, Kellum, Stillions,Shiffer, Burrell, Meyn
  • Winnebago:  Forrestal, Dahl, Bolstad, Loberg, Paulson, Moe, Horvei
  • Winneshiek: Dörr/Doerr, Untereiner, Kruger, Winke, Flage, Henning, Ludeking, Buddenberg, Carolan
  • Woodbury: Berg, Wink/Wienke, Storer,Jessip
  • Worth:  Halgrimson, Vold, Turvold, Moe, Horvei

Family Finder lists: Project Matches

If you have joined any of the Projects at FTDNA, hopefully you’re getting matches or will soon.  Maybe an administrator or another project member has contacted to let you know of a previously unknown 3rd cousin who is also in the project.  Maybe you’ve run a Match Report yourself.  Maybe you’ve joined a project but have no idea if you have any matches within the group.  If so, here are a few tips to help you start finding that information and putting that it to work.

As the administrator of the geographical Iowa DNA Project, I usually run a Family Finder Project Match report for all new members about once a week.  When I find a match, the new member and their matches are notified and supplied with some basic information, including the length of longest shared segment and predicted relationship range.  As the Iowa DNA Project is focused on Family Finder results, this is the most basic data members need to decide where to focus their energy and to start sleuthing out connections.

adm report

If your project administrator doesn’t notify you of Family Finder matches, or you would like to check them yourself, you can easily access the information. Go to your Welcome Page, or DASHBOARD, and in the Family Finder section click on ADVANCED MATCHES:

adv matches

Next, click the box that restricts the database search to Family Finder Results, choose your project from the drop down menu, and click RUN REPORT:

run report

You will then receive a report similar to this, and you will not need to search for your matches within your Family Finder Match list.  Simply click on their names or the icons beside their names to see their tree, send an email etc.

adv report

However, if your project admin or someone else has sent you the name of a match, the simplest way to access the information that can lead to a connection is to search in your Family Finder Match list.  To do this, go to your Welcome Page, or DASHBOARD, and click on MATCHES in the Family Finder section.

dashboard

From your Family Finder Match List click on NAME and a box will appear.  Fill in a name of your match of interest:

search name

You may wish to enter only the surname, as sometimes folks change their profile by adding a middle name, removing a first name or some other alteration that throws off the search function.

resultsIn this case, two people share the surname I searched, and they are both members of the project.  From the list, I can gather their email address, see their family trees, surnames, and any matches we may have in common.  Matching segments can be compared by returning to the Welcome Page/Dashboard and choosing CHROMOSOME BROWSER.

From the Chromosome Browser, click FILTER MATCHES BY and from the drop down menu choose NAME:

chr brow

comparison

In this case, my chromosomes are the dark colored bottom layer, and Jackie and Diane are overlaid in orange and blue, signifying where our segments match.  More often, you will share much less with a project match.

To determine a common ancestor, your goal is TRIANGULATION and you have several options. Naturally, you should try to communicate with your match,  examine family trees, surnames and locations for commonalities.

ICW

You can use the FTDNA IN COMMON WITH feature located beside your match’s name to look for people that are on both your lists.  Perhaps you will recognize the names of other project members. You can then see if you might share the same segment(s) by comparing yourself against your selected matches in the CHROMOSOME BROWSER.  You can also use a third party application to keep track of who and how you match, such as Genome Mate, which I highly recommend.

Whatever methods you use to examine, track and organize your matches, joining a project and using the available tools could very well help narrow your connection to a region and time period if not a specific ancestor.  The more people who test, the more who join projects, and the more who collaborate- the more likely we are to succeed.  Happy Hunting!

Deciphering DNA’s Astrology: Admixture Tools

If your kit isn’t already uploaded to Gedmatch, by all means add it to their free database.  Not only can you compare yourself to testers from all the Big Three DNA companies, but there are numerous tools to explore, including admixture tools.  Even if you are lucky enough to ‘know’ where your family is from, the first portion of results many testers look at is their ethnicity charts, and Gedmatch’s admixture calculators really let you dive in to your ancestry.

When using any of the Admixture, or Heritage/Ethnicity tools, it is vital to understand that they are only estimates of your ancestry.  It is also important to understand that certain components are expected across populations. For example, in Figure 1, we have a group of Irish testers.  Each kit has been run through Eurogenes K13, and the results are displayed in the table.  The circled column to the far right is the average result for a native Irish tester.  As you see, these Irish testers all display a small amount of Native American ancestry despite not having Native American ancestors.  The small percentages are merely an indication of deep ancestry, or DNA that was in the Native American population prior to traveling to the Americas. So, in my grandmother Gladys’s case, even though she has almost 2% Native American according to the calculator, it can be disregarded as not recent.

irish sampler admix

Figure 1

Another important factor to keep in mind is that different tools give different results, based on the populations that are sampled and the populations that the tools are intended for. For example, my grandmother Leona gets results that best fit what we know of her background with the MDLP tools, as she has North Eastern European ancestry. Eurogenes  is the go-to for my Western European and British Isles grandmother Gladys.  Were I predominately of African origin, I would use the Ethiohelix tool, and if I were Euro-African mixed I would gravitate towards the puntDNAL tool. Harrapaworld is for South Asians.

Currently, I have tested with both Ancestry and FTDNA, but my preference for admixture tools remains with Gedmatch because of the flexibility and additional ‘Oracle’ tools.  Depending on the option you choose, Oracles make a ‘best guess’ at the origin of your parents/grandparents. The closer the distance to the population, the more affinity, or more alike your DNA is.

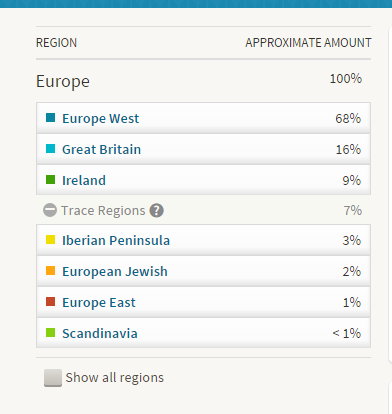
ancestry ethnicityMy Ancestry results are slightly more exotic than FTDNA. My FTDNA results are limited to Western and Central Europe, Scandinavian, and Eastern European.  Given the differences in the estimates, it is easy to dismiss the entire matter as cocktail party conversation.

However, I have tested some of my extended family, and one of my son’s also has extended family beginning to test.  Since we have testers from multiple generations, we can wring a little more information out of the calculators, and have a better idea of what to ignore and what to note.  Plotting the results from various admixture tools we can look for patterns, consistency, and anomalies  across the generations and within known relationship groups.

chart

Figure 2

In the above figure, you can see two separate family groups.  The larger box to the left is my extended family and the smaller box to the right, and above it includes my son Jeremy’s tested relations.

Gedmatch has added a new admixture tool to its roster, Gedrosia DNA. Currently, there is a post tracking results at Anthrogenica.

“This calculator is most accurate for individuals with predominantly S Asian or W Asian Ancestry. It is least accurate for individuals with predominantly African or Native American ancestry. Since I have not used African populations to source allele frequencies, Africans will appear predominantly SW Asian”

No one in my test group is predominantly S Asian or W Asian, but like any other Europeans we have deep W Asian ancestry as well as a mtDNA haplogroup born in Pakistan.  Equally tantalizingly, my grandmother Gladys consistently throws up about double the amount of South Asian as is normally found in an Irish person. I was curious to see what Gedrosia would make of our DNA as a group.

gedrosia 1

Figure 3 Gedrosia K11 Results

As you can see from Figure 2, Gladys is my paternal grandmother, Steve is my father, and Jeremy and Gavan (half brothers) are my sons.  Leona is my maternal grandmother, Jackie is her daughter and my full aunt.  Diane is my (untested) maternal grandfather’s daughter, and Jackie’s half sister.  Our results are falling into line with other Europeans reporting their findings at Anthrogenica, with a few exceptions:

  • My son Gavan returned an out-of -left-field 1.9% Indo-Chinese result.  His Irish born father is currently untested
  • My Irish grandmother and half-Irish father have much less SW Asian than the rest of the group.
  • My grandmother Leona has more East Asian than the rest of the group. The East Asian population sample are the Ulchi, an indigenous group from the far east of Russia. Leona had known Eastern European ancestry.

Gedrosia K11 This calculator’s 11 components peak as follows:

1- WHG (W European Hunter Gatherer) – Loushbour & NE Europeans
2- S Indian – Various S Indian tribal populations, such as Hakkipikki and Nihali
3- Gedrosian – The Baloch, Brahui, and Makrani of Pakistan
4- SW_Asian – Saudis, Yemenis, and Bedouin
5- Siberian – Nganasans
6- EEF ( Early European Farmers) – LBK, Sardinians, and Stuttgart
7- E Asian – Ulchis
8- Caucasus – Georgian, Abkhasians, Adygei, and Balkar
9- Kalash – Kalash of Pakistan
10- Indo-Chinese – Kusunda peoples
11- SE Asian – Ami & Dai.

The second tested family group includes myself and my son Jeremy, as well as Jeremy’s dad’s half brother Anthony/AJ and AJ’s mother Nancy.  Most of the figures in this group tell us what we already have guessed:  our results are standard for Europeans.

gedro 2

Since Jeremy’s dad James is deceased, as is James and Anthony’s dad Jim, we are unable to test them. We haven’t yet gathered enough DNA to recreate their genomes via Gedmatch’s Lazarus tool. Still, there are a couple of oddities to take note of:

  • I have no Indo-Chinese and Nancy has very little, yet both AJ and Jeremy have small amounts which they would have derived paternally
  • AJ has nearly double the amount of Nancy’s SW Asian, which he would have inherited paternally

What can be done with these results to further your genealogy?  Very little, really, as they are more a matter of interest for the curious.  Admixture calculators are being continuously created and will continue to be improved as population samples are added and calculators are refined.

Meanwhile, as long as you remember a few key points enjoy experimenting with the calculators and see if they match what you know about your family:

  • Results are estimates and vary
  • Use the right tool for your background
  • Look for patterns and consistency in results. Make a note of anomalies and note if they also appear in your the results of relatives

August 2015 Quarterly Report

285 members

The Iowa DNA Project was formed at the end of November 2014 and this August has reached 285 members.  The project is ‘geographical’ in nature, and designed for those who have direct ancestors who lived in Iowa, or those who have collateral lines that lived in Iowa. Our focus is on autosomal, aka Family Finder results, but we also have members who have or are in the process of having their mtDNA and YDNA tested.

Key Figures

  • Total Iowa DNA Project Members: 285
  • Family Finder Tests Completed: 234
  • Highest number of database wide matches per member: 3000
  • Lowest number of database wide matches per member: 1
  • Average Number of Database Matches: 234
  • Inter-Project Matches: 170
  • 94 of 99 Iowa Counties Represented by members
  • Multi-Generational Family and Extended Family Testers

iowa mapNuts and Bolts

The Iowa DNA Project Surname Index can be found here.  Surnames associated with specific counties can be found here.  If you have not yet added your surname, family tree, and most distant ancestor details, please consider doing so.  You never know which piece of information may be the one to help you make the connection you need. Now that FTDNA has a SEARCH feature, locating your family lines is even easier.  Also, surnames are again auto-populated when you upload your Gedcom to FTDNA.  You no longer need to enter them manually.

  • Total Iowa Surnames: 592
  • Members with Family Trees:212
  • Members with listed Surnames: 231
  • Members with listed Most Distant Ancestors: 210

Haplogroups

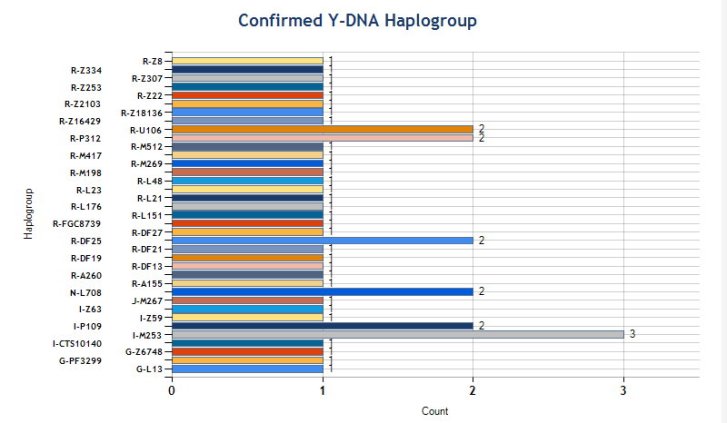
Project YDNAAs expected, the most common Y haplogroup is R and its subclades, with I and its subclades the second most common.  Currently, 16 project members have completed the Big Y test.
y conf

  • R-M269: 47
  • R (excluding R-M269): 31
  • I: 20
  • G: 3
  • E: 2
  • J: 2
  • N: 2

More information on the project’s patriarchs and YDNA results can be found here.

Project mtDNA:  The most common mtDNA continues to be H and its subclades with a variety of other haplogroups also represented. Currently, 80 project members have completed Full Mitochondrial Sequencing.

Member Haplogroups:

  • H: 57
  • K: 14
  • J: 11
  • T: 10
  • U:10
  • I: 3
  • W: 2
  • V: 1

Complete information on our project’s mtDNA matriarchs, statistics and mutations can be found here.

mtdnaDeclared Countries of YDNA and mtDNA Origin

y originmt origin

MyOrigins Leaderboard

Based on percentage points per member, the Iowa DNA Project populations are listed below in order of frequency.  Descriptions of each population cluster can be found here.  Additional admixture tools can be found at Gedmatch.

  • British Isles 9929
  • Western and Central Europe 5525
  • Scandinavia 5448
  • Southern Europe 1276
  • Eastern Europe 1186
  • Finland and Northern Siberia 212
  • Asia Minor 157
  • (Blended Population Cluster) Eastern, Western and Central European 100
  • Central Asia 67
  • West Africa 94
  • Ashkenazi Diaspora 66
  • Northeast Asia 65
  • Eastern Middle East 65
  • Native American 34
  • North Africa 13
  • (Blended Population Cluster) British Isles and Western and Central Europe 1
  • East Central Africa 4
  • South-Central Africa 2

As a matter of admixture interest, there are a handful of project members who are reported as having a single MyOrigins population:

  • 100% British Isles 2 members
  • 100% Western and Central Europe 1 member
  • 100% Scandinavian 1 member
  • 100% Eastern, Western and Central Europe 1 member

Coming Results:

We are all aware of the delays in test results at FTDNA.  In a previous post, I examined the project’s backlog at FTDNA.  I am happy to report the tests referenced in the previous post have long since completed, as well as several Family Finders which were ordered after the post and completed in the expected amount of time.

As you can see, project members are active in the genetic testing arena. Currently, we are waiting for:

  • CTS9940 Batch 629
  • G SNP Pack Batch 631
  • Big Y Batch 635
  • R1b-M343 Backbone SNP Pack Batch 635
  • mtFull Sequence Batch 636
  • Y-DNA111 Batch 636
  • R1b-M343 Backbone SNP Pack Batch 634
  • Family Finder Batch 636
  • Y-DNA67 Batch 632
  • Family Finder Batch 633 (DELAYED)
  • Y-DNA111 Batch 633
  • Y-DNA67 Batch 625 (DELAYED)
  • mtFull Sequence Batch 636
  • mtFull Sequence Batch 635
  • Big Y Batch 633
  • BY250, BY251, CTS1039, CTS2791, CTS8563 Batch 632

 Do You have Iowan Roots?

I would once again like to thank the project members for their many efforts over the previous nine months, and especially their patience when I moved house over the summer and was without internet for a time.  If you would like to join the Iowa DNA Project, please visit our homepage here.  The project has converted to MyGroups and has activated its Activity Feed to encourage collaboration. The Feed may be accessed after joining and of course our links section is available to all.

Beware the Hints: Check and Double Check

Featured imageWith mostly recent and current European ancestry, my newly minted Ancestry DNA results only produced 11 Shared Ancestor hints.  One of which, belonging to Rebecca, suggested our common ancestors are Michael Warren and Catherine Henton, my 7th great-grandparents.  Ancestry classified us as 5th to 8th Cousins with confidence rated as, ‘Good.’

Rebecca happens to have a kit at FTDNA and Gedmatch.  FTDNA reports we share an 8.75 cM segment and Gedmatch reports a 10.1 cM shared segment on chromosome 1.  As Rebecca is also a multi-generational tester, and our Warren/Henton match is through her tested father, I checked for a match with him.  Unfortunately, I did not match her father, nor did either of my maternal aunts who are also Warren/Henton descendents.

Using the FTDNA Chromosome Browser, I entered myself and my aunts, and discovered Rebecca and I did share a segment on chromosome 1 with my Aunt Diane at 7.68 cM.  Gedmatch reported a 7.7 cM match between myself, Diane and Rebecca.

Featured image

In this case Ancestry got it wrong.  We clearly couldn’t be related through her father.  Also, as Rebecca does not match my father or either grandmothers, the match would have to be through her mother and my maternal grandfather.  Rebecca elaborated that her mother’s family is mostly fairly recently immigrated Scottish and Irish.  My maternal grandfather does have Scottish and Northern Irish ancestors, all of which have been in America prior to the Revolutionary War.  Short of a miracle, we are unlikely to ever discover any connection.

Featured image

Ancestry provided another set of matches, one being a 3-4th cousin and the other a 4th-6th cousin with the confidence marked as ‘Extremely High’.  In this instance, the testers were already known: CAK is my tested grandmother’s second cousin and Harold is his son.  We are all descendents of Henry Kane and Catherine Forrestal of Castlebar, Ireland.

Neither have transferred to FTDNA, but both kits have been uploaded to Gedmatch.  At Gedmatch, I share 133.4 cM total with CAK with a longest segment of 50 cM.  With Harold I share 71.1 cM total and 33.1 cM longest.  Following the DNA, in conjunction with our paper trail, my father shares with CAK 125.6 cM total and 50.2 cM longest. He shares  73.8 total  and 33 cM longest with Harold.  My grandmother, CAK’s 2nd cousin, shares 266.4 cM total and 119.9 longest with him and 132.3 cM total and 37.3 longest with his son Harold.  Not only do our family trees match, but our DNA falls within the expected ranges for our relationships and we have other Castlebar Kane cousins who also match in the same place.   In this case, Ancestry seems to have gotten it right.

Featured image

Comparison between Paternal grandmother, CAK and Harold.

I love the idea of Ancestry’s ability to auto search through trees and to find common ancestors.  Although Rebecca is on my FTDNA match list and has two in-common surnames listed, I never spent any time looking into the match as it is so small. Had Ancestry not provided a pre-prepared ‘connection’ I may have never examined the match at all.  Unfortunately, it is clearly wrong, although it appears perfectly reasonable at face value. I am not so sure how many of Ancestry’s customers realize how important it is to follow up these ‘hints’ with other tools that let you directly compare common segments.

I have contacted each of my new matches with Shared Ancestor Hints and urged them to upload their raw data to Gedmatch.   If you are an Ancestry customer and have not already done so, instructions for downloading your raw data from Ancestry are here.  Instructions for uploading your raw data to Gedmatch are here.  Gedmatch is free and gives access to testers from 23andMe and FTDNA in addition to Ancestry.  While taking the time and trouble to compare and triangulate your matches may be more work, it is also reassuringly concrete and a reliable way to accurately trace your .family tree.

May 2015 Quarterly Report

The Iowa DFeatured imageNA Project was formed at the end of November 2014 and this May has reached over 200 members.  The project is ‘geographical’ in nature, and designed for those who have direct ancestors who lived in Iowa, or those who have collateral lines that lived in Iowa. Our focus is on autosomal, aka Family Finder results, but we also have members who have or are in the process of having their mtDNA and YDNA tested.

Key Figures

  • Total Iowa DNA Project Members: 206
  • Family Finder Tests Completed: 179
  • Highest number of database wide matches per member: 1410
  • Lowest number of database wide matches per member: 1
  • Inter-Project Matches: 130
  • Highest number of Inter-Project matches per member: 8*
  • 93 Iowa Counties Represented by members

Featured image

*Not including immediate/close matches

Match Quality

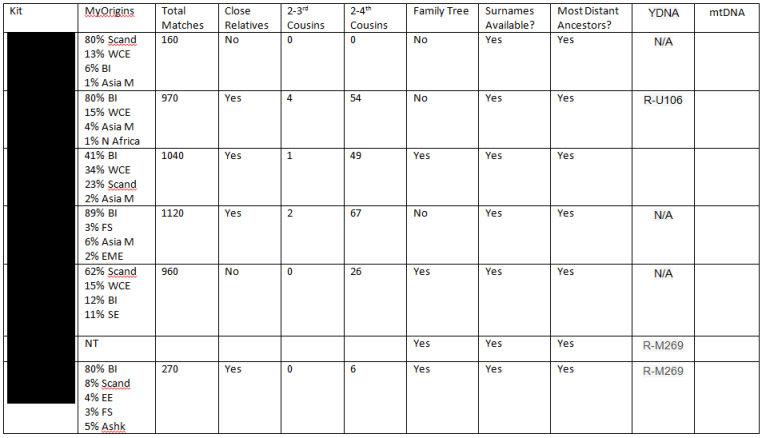
The Iowa DNA Project is fortunate to have several family groups included in its membership.  96 members have immediate and close matches. 47 members have 2-3rd cousins. This is especially helpful in determining genealogical connections.  With family groups, it is often possible to immediately determine whether a match is paternal or maternal, or from a grandparent or great-grandparent’s line.  Generally, the closer the match, the easier the connection is to discover.  Success is also often achieved with 2nd-4th cousins or closer.  Our members average 49 2-4th cousins each.

Nuts and Bolts

The Iowa DNA Project Surname Index can be found here.  Surnames associated with specific counties can be found here.

  • Total Iowa Surnames: 505
  • Members with Family Trees:160
  • Members with listed Surnames: 173
  • Members with listed Most Distant Ancestors: 159

Haplogroups

Project YDNAAs expected, the most common Y haplogroup is R and its subclades, with I and its subclades the second most common.  12 project members have completed the Big Y test.

Featured image  Featured image

Project mtDNA:  The most common mtDNA continues to be H and its subclades with a variety of other haplogroups also represented. 58 project members have completed Full Mitochondrial Sequencing.

Member Haplogroups:

  • H: 38
  • K: 10
  • T: 9
  • J: 9
  • U:7
  • W: 2

Featured image

Declared Countries of YDNA and mtDNA Origin

Featured imageFeatured image

MyOrigins Leaderboard

Based on percentage points per member, the Iowa DNA Project populations are listed below in order of frequency.  Descriptions of each population cluster can be found here.  Additional admixture tools can be found at Gedmatch.
  • British Isles 6989
  • Western and Central European 4179
  • Scandinavian 4061
  • Southern European 866
  • Eastern European 798
  • Finland and Northern Siberia 161
  • Asia Minor 125
  • Eastern Western and Central European 100
  • Central Asia 89
  • West Africa 81
  • Northeast Asia 65
  • Eastern Middle East 53
  • Native American 34
  • Ashkenazi Diaspora 27
  • North African 10
  • East Central Africa 4
  • South-Central Africa  2

Featured image

Coming Results:

We are all aware of the delays in test results at FTDNA.  In a previous post, I examined the project’s backlog at FTDNA.  I am happy to report the majority of the tests referenced in the previous post have completed, as well as several Family Finders which were ordered after the post and completed in the expected amount of time.

Currently, we are waiting for 2 kits to be returned to the lab. We have 16 members who have tested their YDNA or mtDNA but have not yet ordered a Family Finder, and 11 kits that have been transferred but not yet unlocked.  From the FTDNA lab, we are waiting for:

  • CTS11767 batch 587 (due 10/23/2014 DELAY NOTE)
  • FMS batch 621 (due 6/17/2015)
  • mtDNA Plus batch 617 (due 5/20/2015)
  • YDNA 37 batch 617 (due 6/17/2015 DELAY NOTE)
  • 2 Big Y batch 620 (due 6/24/1015)
  • FMS batch 605 (due 5/13/2015 DELAY NOTE)
  • FMS batch 617 (due 5/20/2015)
  • G SNP Pack batch 618 (no estimated due date)
  • YDNA 67 batch 608 (due 5/7/2015 DELAY NOTE)
  • SNP Z255 batch 612 (due 4/15/2015)
  • SNP L159 batch 619 (due 6/3/2015)
  • SNP CTS2509 batch 619 (due 6/3/2015)

 Do You have Iowan Roots?

I would once again like to thank the project members for their patience and many efforts over the last few months.  If you would like to join the Iowa DNA Project, please visit our homepage here.  The project has already converted to MyGroups and has activated its Activity Feed to encourage collaboration. The Feed may be accessed after joining and of course our links section is available to all.

In Common With Tools: Use Your Tools

It is loudly and regularly suggested you test anyone and everyone you can, and with good reason!  Earlier in the year, Blain Bettinger invited the genetic genealogy community to furnish him with, “information about the amount of DNA shared by people having a known genealogical relationship. “  You can read the results of Blain’s study here.

Blaine collected data out to known third cousins.  As I would like to see more of my (and the preceding generations) 1st and 2nd cousins test, and I have four generations of immediate family tested through FTDNA’s Family Finder, I decided to run an experiment of my own. It was my hope that the results would intrigue untested relatives to consider participating in the study.

Had I not harassed persuaded my close relatives to test, I would have a great deal less data to work with, fewer lines proven, and a much harder time discovering relatedness to matches.  Having my grandmothers’ data has also unlocked an ancestral picture that had largely evaporated by the generation of my children.

If you are a member of FTDNA, you can use the In Common With tool to see matches you have in common with another tester.  For close relatives such as parents/children, this will help determine whether the match in common is maternal or paternal.

Featured image

Leona:

310 Total matches

  • Jackie: 130 matches in common.  3381.16 cM shared (parent/child)
  • Lori: 100 matches in common.  1918.26 cM shared (grandparent/grandchild)
  • Jeremy: 30 matches in common.   820.74 cM shared (great-grandparent/great-grandchild)
  • Gavan: 60 matches in common.   932.45 cM shared (great-grandparent/great-grandchild)

As you can see, Leona’s great-grandsons share 60 and 30 matches with her.  Had they been the first generation to test, and had only Gavan tested, he would have lost half of his generation’s potential connections.

Gladys:

660 Total matches

  • Stephen: 260 matches in common.  3382.68 cM shared (parent/child)
  • Lori 180 matches in common.  2011.93 cM shared (grandparent/grandchild)
  • Jeremy  50 matches in common.  965.18 cM shared (great-grandparent/great-grandchild)
  • Gavan 110 matches in common.  1110.03 cM shared (great-grandparent/great-grandchild)

Similarly, Gladys’s great-grandsons share a markedly different number of matches with their great-grandmother.   Had Jeremy and Gavan been the only members of the family to test, not only would they have lost between 610-540 of her matches, but also would also have needlessly lost 60 of them if only Jeremy had tested

Stephen:

370 Total matches

  • Gladys: 260 matches in common.  3382.68 cM shared (parent/child)
  • Lori: 170 matches in common.  3382.91 cM shared (parent/child)
  • Jeremy: 50 matches in common.  1612.12 cM shared (grandparent/grandchild)
  • Gavan: 110 matches in common.  1910.94 cM shared (grandparent/grandchild)

Fortunately, my grandmothers were able to test.  Otherwise, had my father been the oldest generation to test, we would have lost 400 of my paternal grandmother’s matches.  Had I been the oldest generation to test, we would have lost nearly 500 of my grandmother’s matches and 200 of my dad’s.

On the maternal side of the family, I have a full aunt and a half aunt who have tested.  They share the same father who is unavailable to test.

Jackie:

500 total matches

  • Leona: 130 matches in common.   3381.16 cM shared (parent/child)
  • Diane: 130 matches in common.  1770.68 cM shared (half siblings)
  • Lori:  160 matches in common.  1882.17 cM shared (aunt/niece)
  • Jeremy: 50 matches in common.  989.45 cM shared (great aunt/great nephew)
  • Gavan: 60 matches in common.  788.90 cM shared (great aunt/great nephew)

Diane:

530 Total Matches

  • Jackie: 130 matches in common.  1770.68 cM shared (half siblings)
  • Lori: 50  matches in common.  683.35 cM shared (half-aunt/half-niece)
  • Jeremy: 40 matches in common.  411.12 cM shared (half great aunt/half great nephew)
  • Gavan 30 matches in common.  290.97 cM shared (half great aunt/half great nephew)

Jackie inherited 180 of her mother Leona’s matches, and the other 320 matches, excluding IBS can be assigned to the father she and Diane had in common.  However, of those 320 matches, Jackie and Diane only have 130 in common.  Had both sisters not tested, we would have lost a potential 190 matches from my paternal grandfather.  I have also tested, and have 50 matches in common with Diane, which could only have come from their shared father and my paternal grandfather.  Had Diane and I been the only members of the family to test, we would only be able to confirm those 50 matches as derived from my paternal grandpa.

Had testing begun with my generation in tandem with my sons we can see from the figures below how many matches would be lost and unassigned:

Lori:

540 Total matches

  • Leona:  100 matches in common of 310. 1918.26 cM shared (grandparent/grandchild)
  • Gladys: 180 matches in common of 660. 2011.93 cM shared (grandparent/grandchild)
  • Stephen: 170 matches in common of 370.   3382.91 cM shared (parent/child)
  • Jackie: 160 matches in common of 500. 1882.17 cM shared (aunt/niece)
  • Diane: 50 matches in common.  683.35 cM shared (half-aunt/half-niece)
  • Jeremy: 130 matches in common.  3378.94 cM shared (parent/child)
  • Gavan:  210 matches in common.  3382.74 cM shared (parent/child)

Jeremy:

570 Total matches

  • Lori: 130 matches in common.  3378.94 cM shared (parent/child)
  • Stephen: 50 matches in common.  1612.12 cM shared (grandparent/grandchild)
  • Gavan: 80 matches in common.  1464.48 cM shared (half siblings)
  • Gladys: 50 matches in common.  965.18 cM shared (great-grandparent/great-grandchild)
  • Leona: 30 matches in common.  820.74 cM shared (great-grandparent/great-grandchild)
  • Jackie: 50 matches in common.  989.45 cM shared (great aunt/great nephew)
  • Diane: 40 matches in common.  411.12 cM shared (half great aunt/half great nephew)

Gavan:

700 Total Matches

  • Lori: 210 matches in common.  3382.74 cM shared (parent/child)
  • Stephen: 110 matches in common.  1910.94 cM shared (grandparent/grandchild)
  • Jeremy:  80 matches in common.  1464.48 cM shared (half siblings)
  • Gladys: 110 matches in common.  1110.03 cM shared  (great-grandparent/great-grandchild)
  • Leona: 60 matches in common.  932.45 cM shared  (great-grandparent/great-grandchild)
  • Jackie: 60 matches in common.  788.90 cM shared (great aunt/great nephew)
  • Diane: 30 matches in common.  290.97 cM shared (half great aunt/half great nephew)

My sons would have lost between 280-250 of the matches we gained by testing my maternal grandmother.  They would have lost between 610-550 of the matches we gained by testing my paternal grandmother.  Had Jackie not tested, they would have lost her 320 matched attributed to my maternal grandfather.  Had Diane not tested, they would have lost between 90 and 100 matches with my paternal grandfather.

If you are wondering whether it is worth having those aunts/uncles/siblings/sibling of your grandparents/cousins etc tested, it is!  In my case, we have found it invaluable.

More about Gladys and Leona’s statistics and ancestral backgrounds can be learned here.

Projects: Use Your Tools

With the rollout of FTDNA’s MyGroups and global search tool, tackling your match list just might get a little easier.  You can learn about the advantages of projects and how to join here.  If you’d rather not manually search through the project index, you can experiment with the ‘Search Tool’.  The tool can be found on your Welcome Page:

Featured image

Investigate!

Once you have entered a surname or location of interest, you’ll be provided with a list of projects that have indexed your surname, as well as a list of relevant family trees.  This is another reason to make sure you’ve entered your surnames, uploaded a family tree, and reminded your project administrators to add your surnames to the index.  This will help others using the search tool find you.  With luck, the search tool can transform Family Finder mystery matches to a familiar surname or location that can lead to discovering connections.  You can learn more about adding gedcoms and surnames here.

Featured image

Collaborate!

Tree accessibility is dependent on individual privacy settings.  You can adjust your settings from the ‘Privacy Settings’ dropdown.  I want my tree to be available to non-matches as well as matches, so have chosen the ‘Public’ setting.  When working with common last names and speculative ancestors, it can be just as important to be aware of who you don’t match as who you do match.

Featured image

Help Your Matches Help Yourself

If you want your profile information to be visible to project members, from the ‘Who Can See Me in Project Member Lists’ section choose the ‘Project Members’ setting.

Featured image

Compare Notes

With MyGroups, project members have the opportunity to compare notes and make contact on the Activity Feed. When members post information, visible profiles identify, among other things any surnames in common.To access your fellow project members profile info, from the Activity Feed click on the number of members in a project:

Featured image

Group Effort

At the Iowa DNA Project, match notifications are sent out on a weekly basis.  At last count, 143 of our members have inter-project matches.  Some connections are already known, some are narrowed down to specific branches, and many are still being worked on.  The more we collaborate, and the more of the tools we take advantage of, the more likely we are to achieve success.